Application tour through MOLEonline 2.0
Loading structure
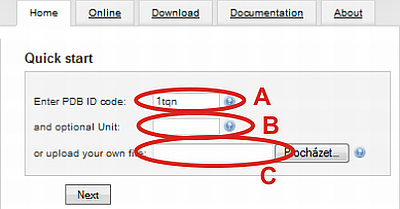
You can start your tunnel calculation with loading of structure (A) by specifying PDB ID (automatically load from RCSB Protein Data Bank) or (C) by uploading your own file from hard drive.
(B) In the case of PDB ID file, you can specify whether the biological unit should be used instead of assymetric unit (default, no value selected). Biological units are numbered from nr. 1.
For example choose PDB ID 1tqn and click on Next button.
If your structure has more than one subunits, please prepare your structure in relevant software to contain only the subunits/chains you wish to use prior computation (another option is the use of MOLE 2.0 desktop application, which will be released in a near future).
Preparation of calculation
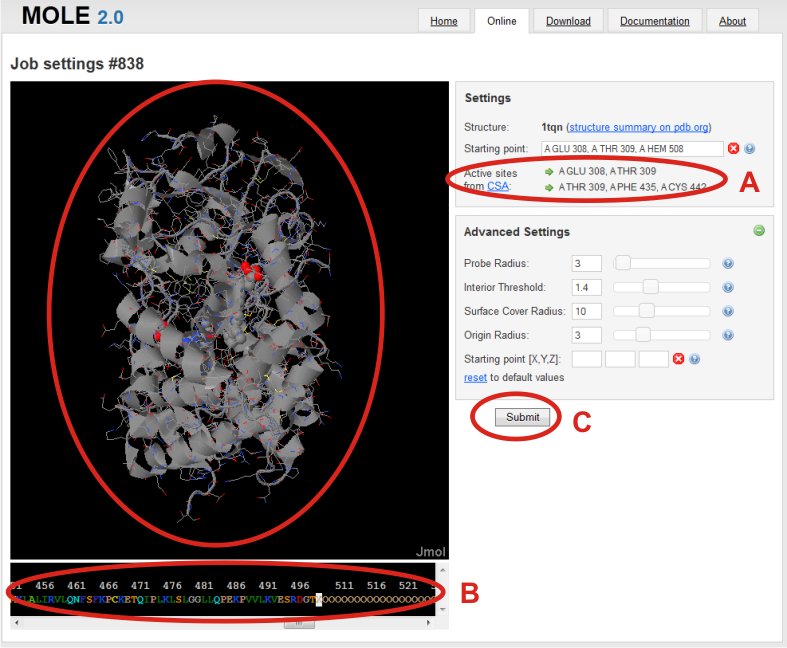
Job settings page is shown after loading of structure. Here your calculation got an job id, which can be later used to return to the tunnel calculation and even modify it.
In the right panel, you can see which structure was used for calculation you can specify a Starting point from where the calculation of tunnels will be processed.
You can specify the starting point by the residues of your choice, or (A) you can use offered residues from Catalytic Site Atlas (CSA). Starting point is then refined in a sphere around averaged position of those residues defined by Origin radius parameter.
For example in the case of 1TQN: A GLU 308, A THR 309 or A THR308, A PHE 435, A CYS 442.
Another way how to specify the starting point is to select residues by clicking on them in the sequence panel in the bottom of the page. (B)
If you are not aware what residue you want to select, but you see it in the structure in Jmol visualization of the molecule in the left panel, you can learn its name and number via Jmol labeling tool. Right click on Jmol window to enter menu and then go to Measurement submenu and follow to Label. Next, you will select residues upon click on them. With knowledge of the residue number, it is then easy to select it in the sequence panel on the bottom of the page.
Last but not least, starting point can be selected by specifying by its X, Y, and Z coordinates.
Be also aware, that MOLEonline 2.0 for the sake of simplicity use all ATOM and HETATM entries in the pdb file exluding water molecules (defined by SOL, WAT, HOH, residues). So if you want to exclude some HETATM, you have to either prepare your pdb file manually and upload it or use MOLE 2.0 desktop application, which has more selection choices.
After choosing starting point, (C) you can continue by clicking on Submit to process your job or set advanced settings in the right panel with (+) button.
Advanced settings
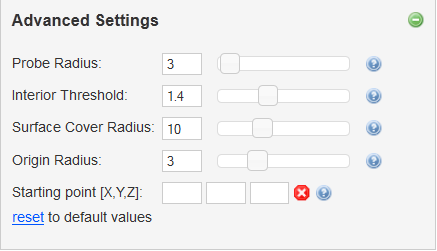
Advanced settings offers possibility to adjust parameters determining tunnel searching algorithm. All parameters are set in Angstroms (0.1 nm):
- Probe radius - Radius used for construction of surface of biomacromolecule.
- Interior threshold - Approximate smallest tunnel radius to use.
- Surface Cover Radius - Determines the density of tunnel exits on the molecular surface.
- Origin radius - Localization of starting point within this radius.
- Starting point [X,Y,Z] - Precise localization of starting point instead of list of residues.
After choosing all settings which you need, you can continue by clicking on Submit. Now your job is being processed on our server. Calculation takes typically less than 10 seconds
Tunnels visualization
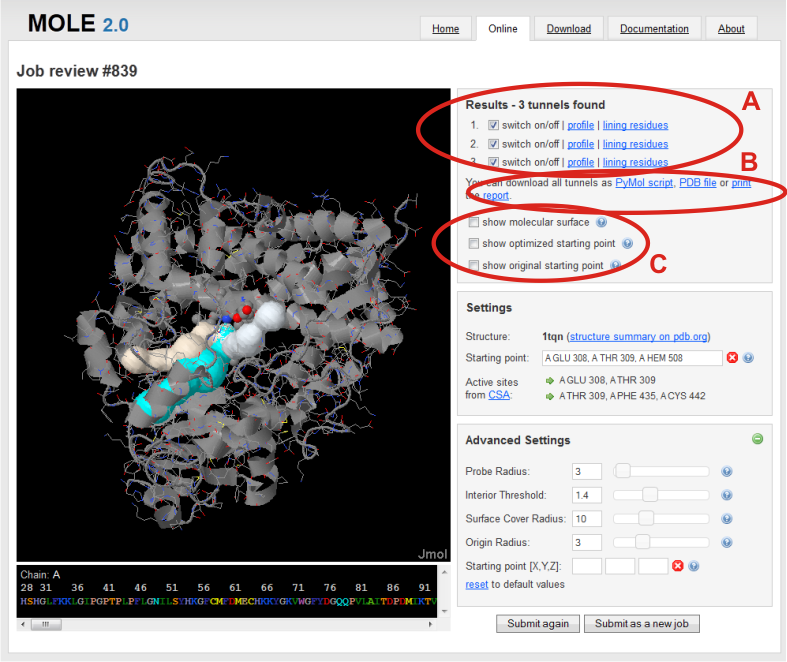
After the calculation, resulting tunnels can be found in a Results box in the right panel. Here, you can choose to switch on/off any tunnel to visualize it in Jmol window (A).
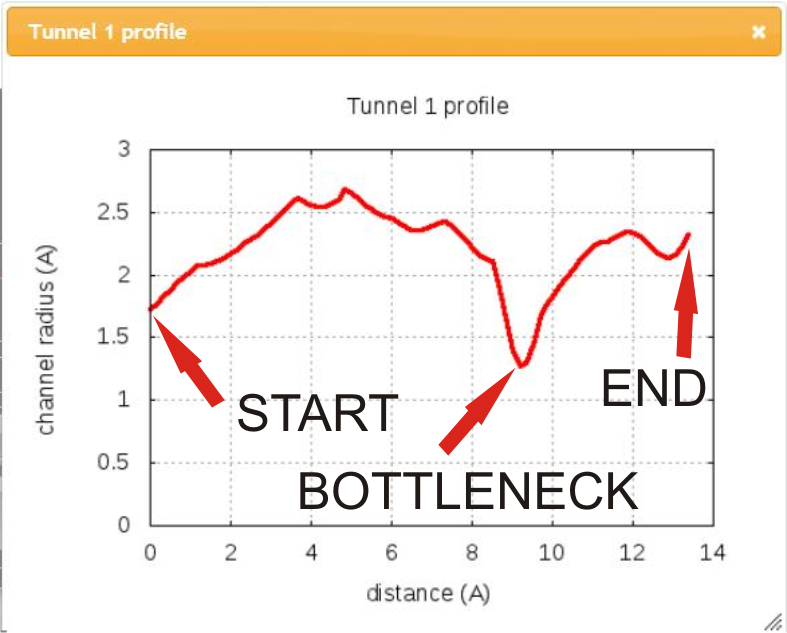
In addition, you can show chart of tunnel profile radius and/or show a list of lining residues bordering tunnel in separate windows.
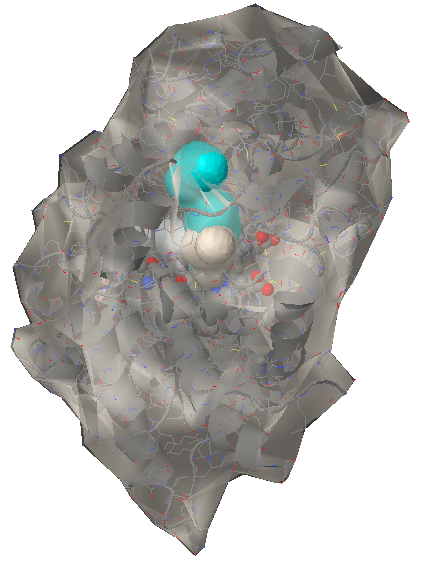
You can also export results (see bellow) (B) and show the molecular surface and starting points before optimization and after optimization with Origin radius parameter (C).
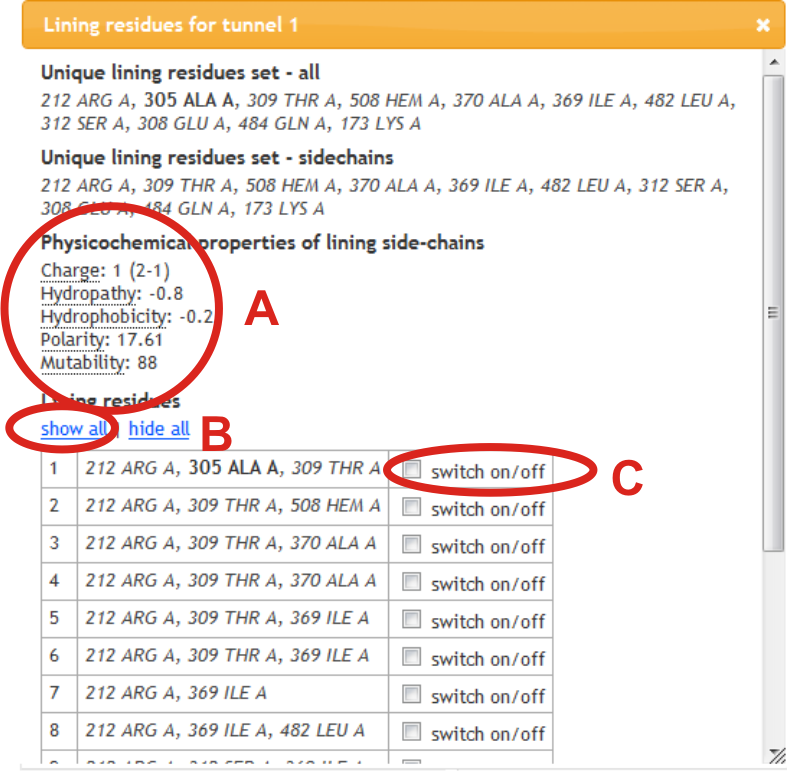
Physicochemical properties of side-chains of residues are calculated (A). Lining residues can be also shown in Jmol panel by selection within lining residue window of all per tunnel (B) or individually (C). Residues lining tunnel with their main-chain or side-chain are shown in bold or italics, respectively.
Results can be later accessed on http://www.mole.upol.cz/online/job id.
Export of results
Results can be obtained in several forms:
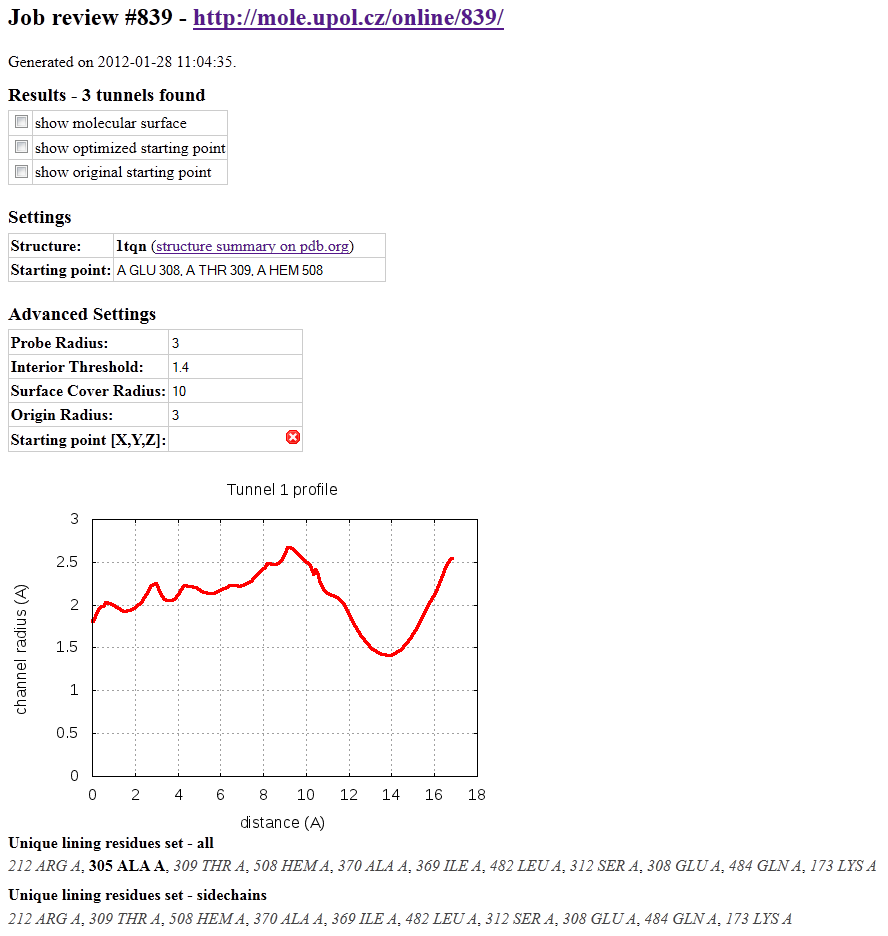
Firstly, they are summarized in a form of report (Figure on the right). Report contains job id and web address as a possible reference for revisiting your results in the future. It also contains advanced settings which were used for tunnel search. Next all detected tunnels are sorted with profile radius chart and with lining residue list. Unique lining residue set is also printed with selection of lining residues which border tunnel with sidechain and are therefore more suited for sidechain movements and possible mutation
You can preview report or immediately print it directly from the browser's menu. Report can be downloaded as a html file with "Save as..." option.
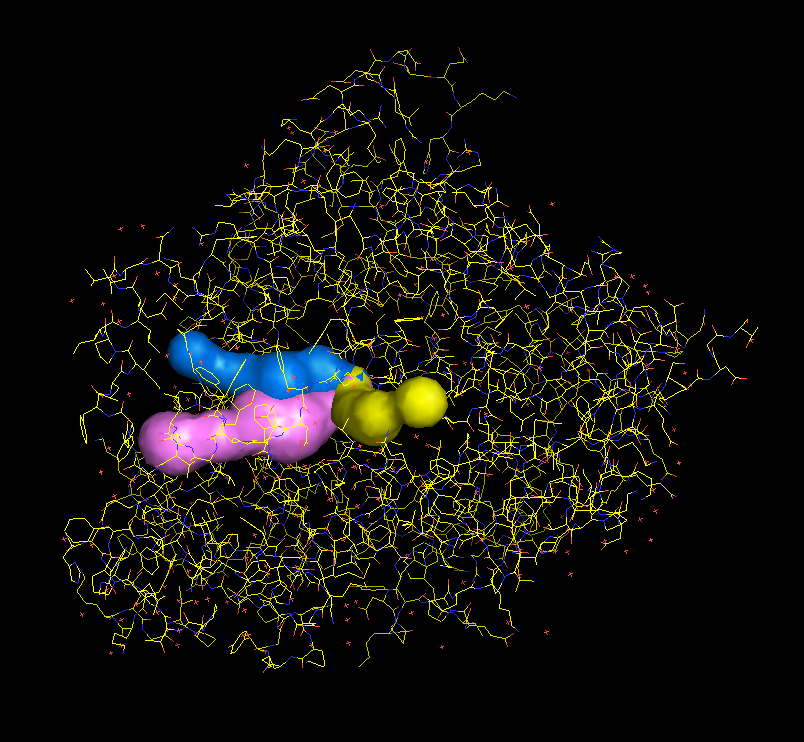
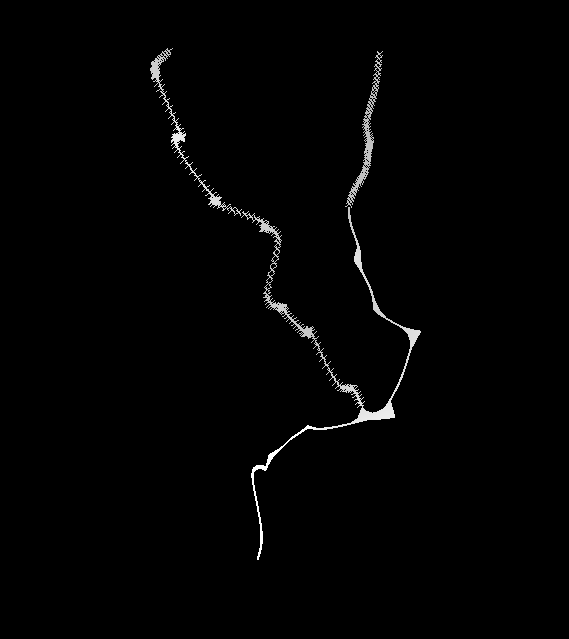
Tunnels can be downloaded in a form of PDB file with dummy atoms lining the tunnel. Radius of the tunnel at every position is saved as a b factor (Figure in the middle).
A python script for quick visualization of tunnels in Pymol can be also downloaded. It can be later shown in Pymol through File > Run option. (Figure on the left)